The Gild Debug View was briefly discussed in the section "The Gild Perspective: Features>The Gild Debug View". Now that we are debugging a program, the view presents us with some information. It is important to understand this information:
Basically, the Gild Debug View gives us a listing of all of the variables that are currently visible to the program, and their values.
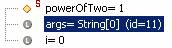
In the above image, we can see three variables, powerOfTwo, args,
and i. The image to the left of the name of the variable gives
us some information about how the variable was declared. In this example, the
 diamond beside
 powerOfTwo tells us
that this variable was declared as protected within
the PowerOfTwo class; the 's' tells
us that it is a static field of PowerOfTwo.
The ![]() circle beside
circle beside args
and i tells us that these two variables are local
to the method or block of code that is currently running.
On the right-hand side of the variable names and the '=' sign, we can see the
variable's type and value. If the variable is a basic data type (as are powerOfTwo
and i) then only the value is displayed. If the variable is a complex
data type, such as an Object or and array (as is args) then the
data type is displayed along with a unique id. The id is there so that the computer
can distinguish between two different objects of the same type (it is the debugger’s
interpretation of a reference).
Now, we can continue to use the Gild Debugger to understand what is wrong with our code.